
Mapping, Delineating and Monitoring of Hydrocarbon Contamination using ECOPROBE 5
The detection of organic contaminants such as Light Non-Aqueous Phase Liquids (LNAPL) and Dense Non-Aqueous Phase Liquids (DNAPL) in the sub-surface has been the subject of considerable interest among earth-scientists in recent years. NAPL contamination may differentiate into at least four distinct forms, each of which has unique chemical and geophysical characteristics. There is a free product which is mobile or free to migrate under gravitational pull. Secondly, the residual phase is that portion which is left behind after the free product has migrated. Thirdly, volatile NAPLs may have developed a vapor phase plume in the space above the free product and the residual product. Finally, small amounts of hydrocarbon may enter the aquifer as a dissolved phase.
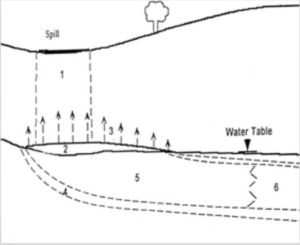
Cross-section diagram of zones around an LNAPL spill site, static water table case (after Sauk, 2000):
1 – vadose zone directly beneath the spill,
2 – free (mobile) product and residual product zone,
3 – vadose zone directly above the free/residual product,
4 – reactive fringe around the dissolved plume,
5 – anaerobic core of the dissolved plume,
6 – distal end of the dissolved plume.
Extensive field and laboratory studies have been conducted to investigate both geophysical and soil vapor responses to hydrocarbon contaminants. Geophysical studies have shown that hydrocarbon spills in the natural environment may after a lapse of time produce changes in many electrical properties from resistive to conductive due to biodegradation. It is likely that the time elapsed after the spill and before the geophysical survey is a crucial factor. Early surveys (within the first months) may yield results entirely different from those from much later surveys. Further, there may be an intermediate period during which there will be little or no anomalous response, midway in the transition from resistive to conductive behavior of the system. The rapid weather change from rain to intense sunshine may cause resistive changes and chemical contaminant changes in sub-surface environment. All of the above mentioned processes may lead to misinterpretation of resistive data.
Soil Vapor Survey: previous Soil Vapor Survey methods did not reflect natural subsurface conditions and interpretations often yielded unreliable results. This fact caused the Soil Vapor Survey to be wrongfully left behind other methods.
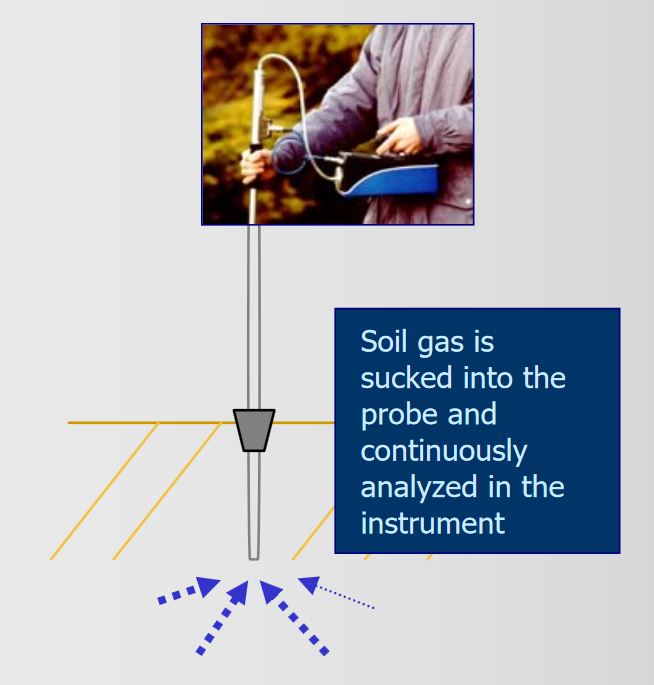
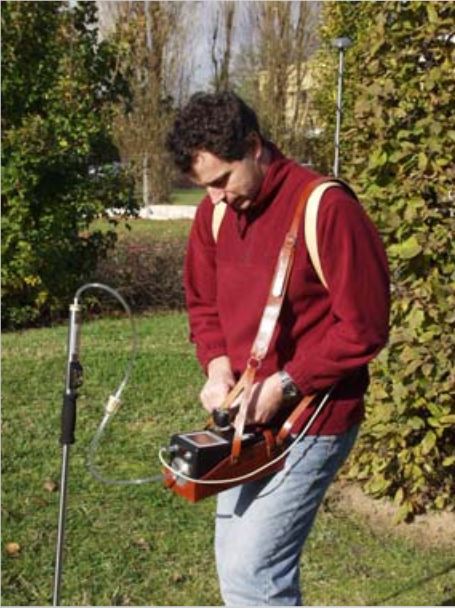
RS DYNAMICS has been developing the ECOPROBE method since 1989. The improved instrument ECOPROBE 5 is based upon the most advanced technology and extensive field experience, providing flexibility, convenience and quality for the in-situ detection and analysis of VOC’s. This is the result of its unique combination of a PID analyzer (for measurement of total soil gas concentration) and a selective IR analyzer (for the separate measurement of Methane, Petroleum Hydrocarbons and Carbon Dioxide). The resulting set of parameters is further complemented by temperature, pressure and oxygen measurement. The vapor phase caused by hydrocarbon contamination exists under different weather conditions, with higher volatility in sunny weather. Temperatures below the freezing point represent the only limitation since the vapor phase shows almost no volatility when temperatures are low. It is easy to distinguish between a recent and a long-standing contamination: the long-standing contamination shows up mostly as Methane due to natural bioremediation activity. ECOPROBE 5 offers a new methodology that addresses and compensates for ost of the natural conditions and accomplishes the difficult task of capturing and interpreting soil contamination in a truly scientific way.
The most important subsurface factors that affect insitu soil contamination measurements are:
- Soil permeability: soils with different properties of permeability create different soil vapor evaporation conditions. Due to their inner structure, relatively impermeable soils such as clay produce soil vapors for much shorter periods of time compared to highly permeable soils such as sand.
- Presence of Methane: as a product of natural biodegradation, Methane occurs in varying concentrations everywhere in the sub-soil environment.
The presence of Methane and the existence of widely different soil permeabilities are the two crucial distorting factors in soil vapor measurement. Both dramatically affect the resulting measured values of contaminant concentrations. Without the benefits of the new ECOPROBE method, these misleading results cause severe misinterpretation of both in-situ and laboratory measurements.
The ECOPROBE 5 displays sequences of measured values on the screen, thereby providing important information about the soil conditions in the given environment, and specifically on the potential capability of soils of differing permeabilities to provide the soil vapor necessary for measurement. Graphs showing sequences of measured values can then be stored in the instrument. To illustrate this point, the graphs on the right were obtained using identical quantities of clay and sand soil samples, into which an identical quantity of contaminant had been mixed. For general survey purposes, ECOPROBE 5 offers a special mode showing the highest measured value at each measured station. This mode enables measurement compensation for different soil permeabilities (see arrows on the graphs on the right). ECOPROBE 5’ s advanced GPS data logging is particularly suitable for large areas to be surveyed and enables the operator to move freely to any measured station without reference to the station location. All measured data are automatically linked with the GPS coordinates of the measured station. Consequently a data spreadsheet is automatically created for rapid interpretation.
Longer-standing surface hydrocarbon contamination usually has been changed into aromatic compounds which do not show any readings on the instrument screen since the volatile vapor phase has already evaporated. Aromatic hydrocarbons have an obvious smell and a very dark color of the contaminated soil may give the impression of a large contamination. Usually regular measurement from 1 meter deep holes show Methane and/or Total Petroleum readings, depending on the age of the contamination.
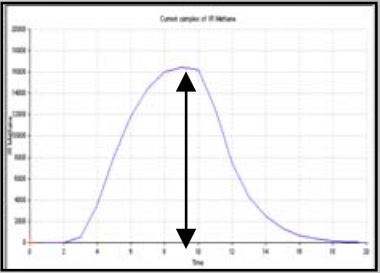
Sequence of measured values from poorly permeable soil -clay. Evaluated by ECOPROBEVIEW Software. The sharp decay rate of the curve indicates the insufficient porosity of the soil environment.
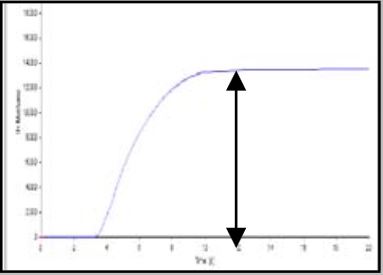
Sequence of measured values from highly permeable soil - sand Evaluated by ECOPROBEVIEW Software. The “zero” decay rate of the curve indicates the perfect porosity of the soil environment.
- The given combination of values measured by ECOPROBE 5 helps to distinguish various contaminants and facilitates a more accurate overall picture of them.
- Methane, CO2, Oxygen and temperature levels indicate subsurface bacterial activity.
- Separate measurement of Methane and other hydrocarbons helps to distinguish a long-standing contamination from a new one.
- Pressure measurement gives data relating to the progress of micro-venting processes.
- The graphs showing sequences of measured values (above) reflect soil structure and porosity.
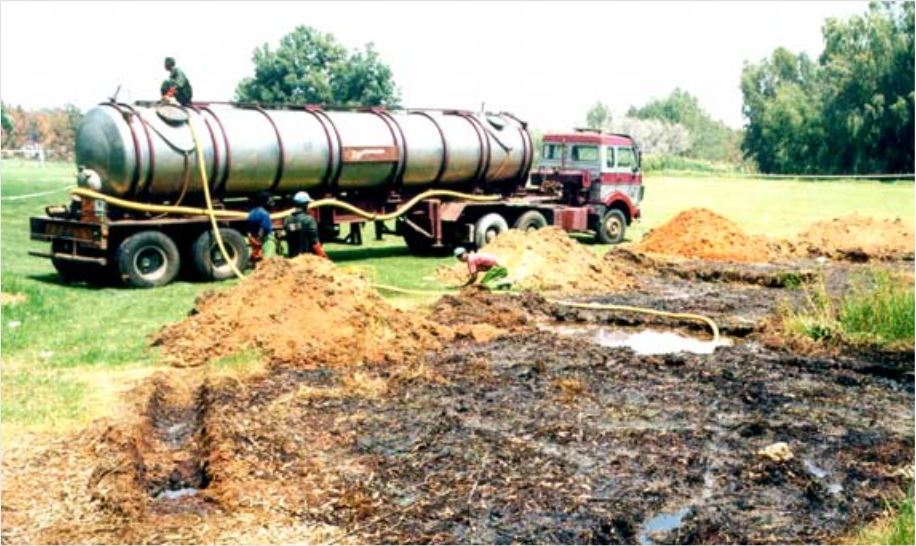
Test Site
The study site was in the area surrounding a railway terminal, where the hydrocarbon products are transferred from tank wagons to underground storage tanks. The leakage from pipes and badlyinsulated large volume tanks – getting rusty during the 30 years long period and finally being perforated — caused serious LNAPL pollution with a thick layer of kerosene at the water table. The test site is situated in the Middle Turonian sandstone. Quaternary alluvial sediments form the first 3-m thick layer. The above-mentioned clearly-defined sandstone with clay content up to 5% has been found even deeper. The water table level is 3,5-m deep with small fluctuations during the year.
Applied Methods
At the test site the soil contamination survey used ECOPROBE 5 technique and in one area of the test site ECOPROBE 5 soil contamination survey was combined with geophysical methods.
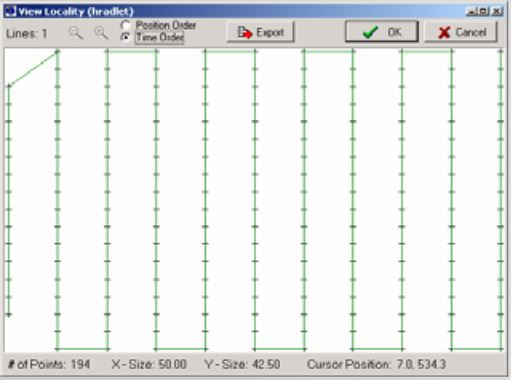
The trajectory of measured station – standard data logging print-out obtained from communication program (one-day measurement).
Soil Contamination Survey
Ecological accidents where hydrocarbons have been spilt or leaking into the ground are typical and most common examples where the very portable ECOPROBE 5 instrument offers the fastest and most cost-effective method for mapping, delineating and monitoring the contaminant pollution. Fast pollution delineating and consequent site cleaning are the most important tasks to prevent a contaminant from reaching the underground water table. Generally, the contaminant is known and there is no need to have preciselaboratory analyses from each measured station. Nevertheless, it is recommended to have 3-5 samples from the entire site analyzed. The test site is situated in permeable sandstone and alluvial sediments, very suitable for the soil vapor survey. About 100 stations were measured in one day.
Interpretation
The wire frame maps below were obtained from Surfer within 10 minutesusing a datasheet which the ECOPROBEVIEW communication program automatically creates from data saved in ECOPROBE 5. The wire frame maps show both a longer-standing and a more recent contamination.
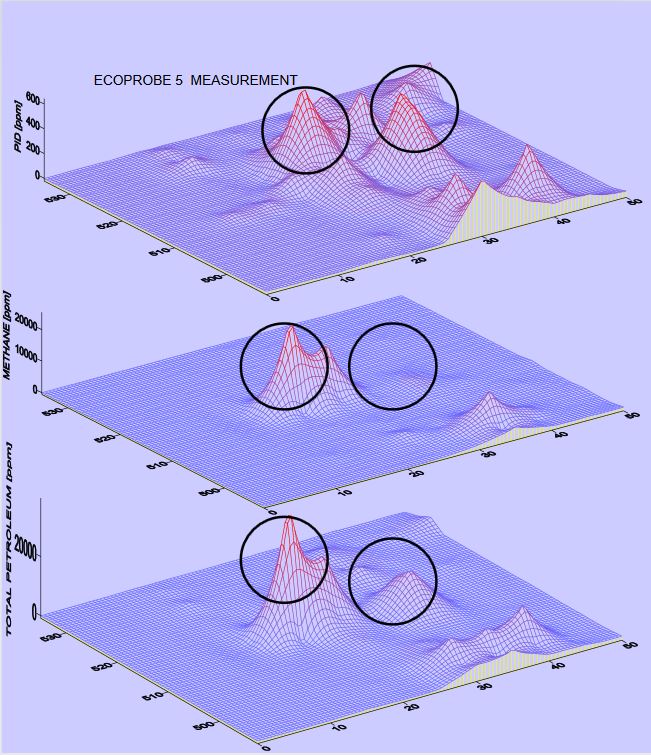
Longer-standing Contamination:
This desription is relevant to left-side circle zones in above picture:
- The PID channel indicates contamination in theform of volatile organic compounds (excluding methane). In case of rocarboncontamination PID measures mostly hydrocarbon compounds.
- IR Methane channel indicates extensive bacterial activity (bacteria produce methane) typical for long-standing contaminations.
- The IR TP channel measures petroleum hydrocarbons including Methane. Longstanding contamination shows up mostly as Methane on the TP graph, but the hydrocarbon product is still presented (values on TP channel are higher than on Methane channel; see also PID indication).
Recent Contamination:
This desription is relevant to right-side circle zones in above picture:
- The PID channel indicates contamination (mostly hydrocarbon compounds).
- IR Methane channel indicates that bacterial activity has not yet started. There is only a weak Methane indication on the Methane graph.
- The TP channel indicates hydrocarbon compounds present in recent contamination.
The obtained graphs and maps give a perfect overview on the contaminated site. The consequent site cleaning and decontamination process can be easily monitored using the same ECOPROBE 5 technique.
COMPARISON OF GEOPHYSICAL AND SOIL CONTAMINTAION SURVEY METHODS
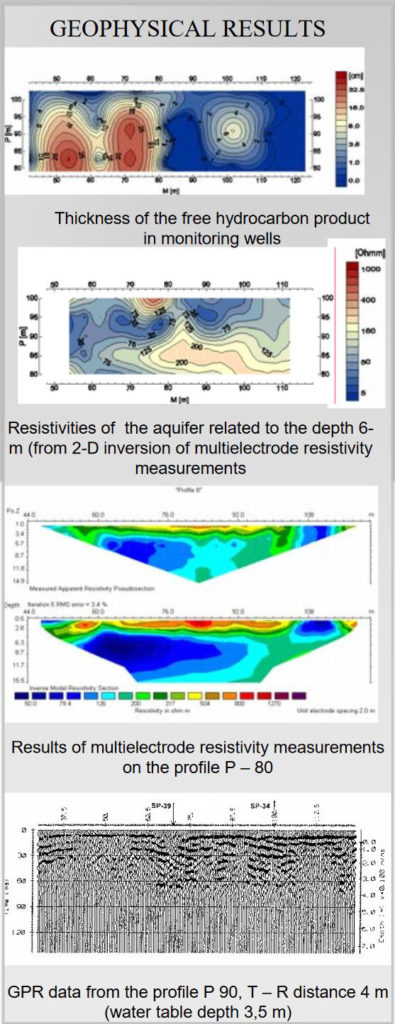
In one area of the test site geophysical methods were combined with soil contamination survey technique using ECOPROBE 5 instrumentation. A lot of buried metal objects (pipes, cables etc.) complicated the geophysical survey. The following geophysical methods were applied on 5 parallel 100-m long profiles 5 m apart.
- Multi-electrode resistivity measurements with electrodes 2 m apart
- Resistivity measurements using vertical probes up to 6 m apart with 0,5 m electrode distance
- Ground penetrating radar GPR – 200 MHz antenna, 2 and 4 m distance T – R with 0,5 m measuring step (instrument pulse EKKO – 100A, Sensor & Software Co.)
- Cone penetration tests CTP with gamma-ray density, neutron porosity, conductivity and permitivity logging.
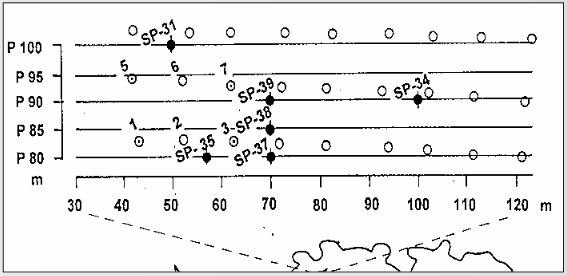
Situation of the test site:
o - monitoring and clean-up wells
• - cone penetration tests with geophysical logging
Contour maps on the right show geophysical and ECOPROBE 5 soil contamination measurement results.
Extent of the low resistivity zone according to resistivity and GPR measurements corresponds well with the soil vapor survey results and both correlate with the free hydrocarbon product area according to sampling of monitoring wells. ECOPROBE 5 soil contamination survey method takes much less time than other methods used for hydrocarbon contamination survey and provides very descriptive data about the contaminated area.
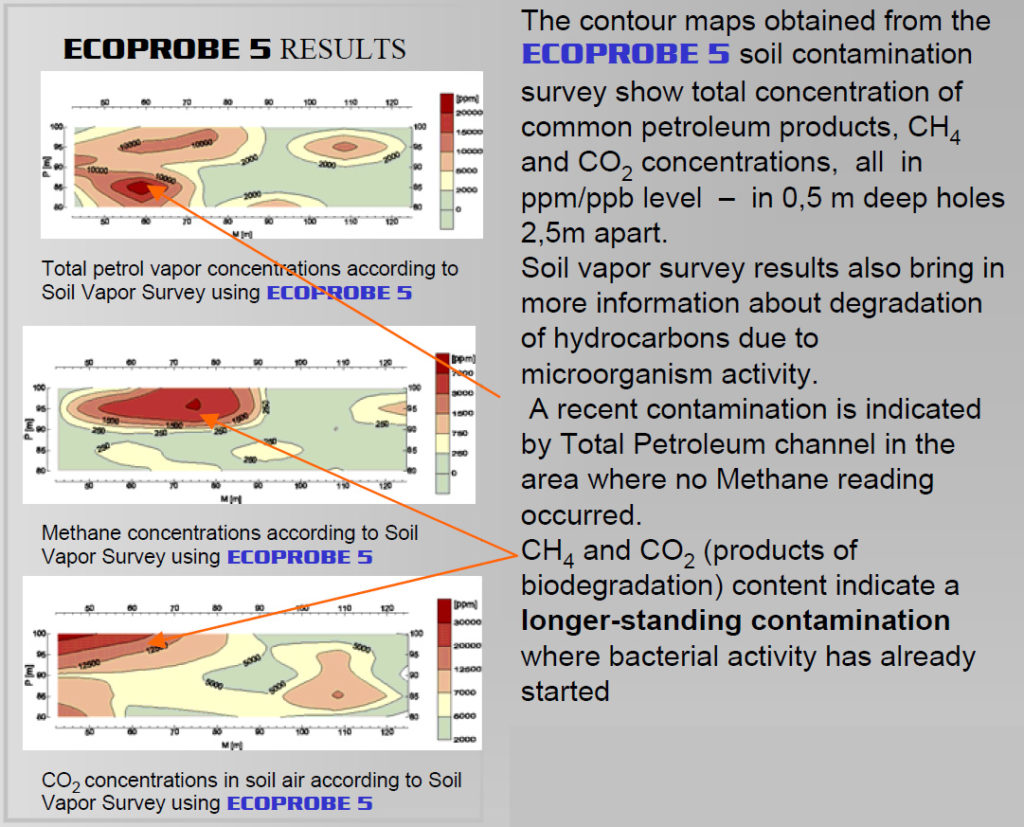
The contour maps obtained from the ECOPROBE 5 soil contamination survey show total concentration of common petroleum products, CH4 and CO2 concentrations, all in ppm/ppb level – in 0,5 m deep holes 2,5m apart. Soil vapor survey results also bring in more information about degradation of hydrocarbons due to microorganism activity. A recent contamination is indicated by Total Petroleum channel in the area where no Methanereading occurred. CH4 and CO2 (products of biodegradation) content indicate a longer-standing contamination where bacterial activity has already started.
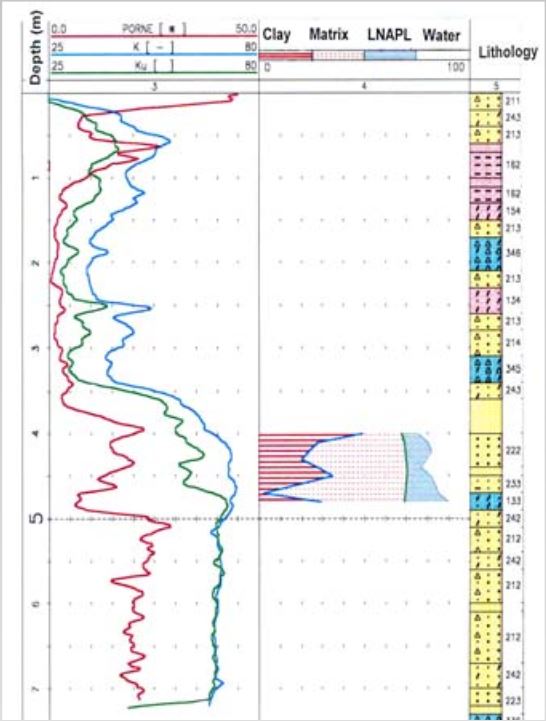
Logging of the cone penetration hole SP-39: presence of LNAPL at the top of saturated zone is documented by neutron porosity (PORNE – red) and permitivity logs (K) measured down (blue) and up (green). Lithology: sand (…. yellow), clay (- - - red), gravel (ΔΔΔ blue).
Under present conditions kerosene still irregularly contaminates the upperpart and base of the vadose zone and the top part of the saturatedzone and free hydrocarbon product can be found in monitoringwells. The contaminated area is still being remediated and thecleaning process and bacterial activities are still being measured andmonitored using ECOPROBE 5 instrumentation.